You posted a TikTok three hours ago. It's got 247 views.
Is that good? Should you be worried? More importantly: what do you do next?
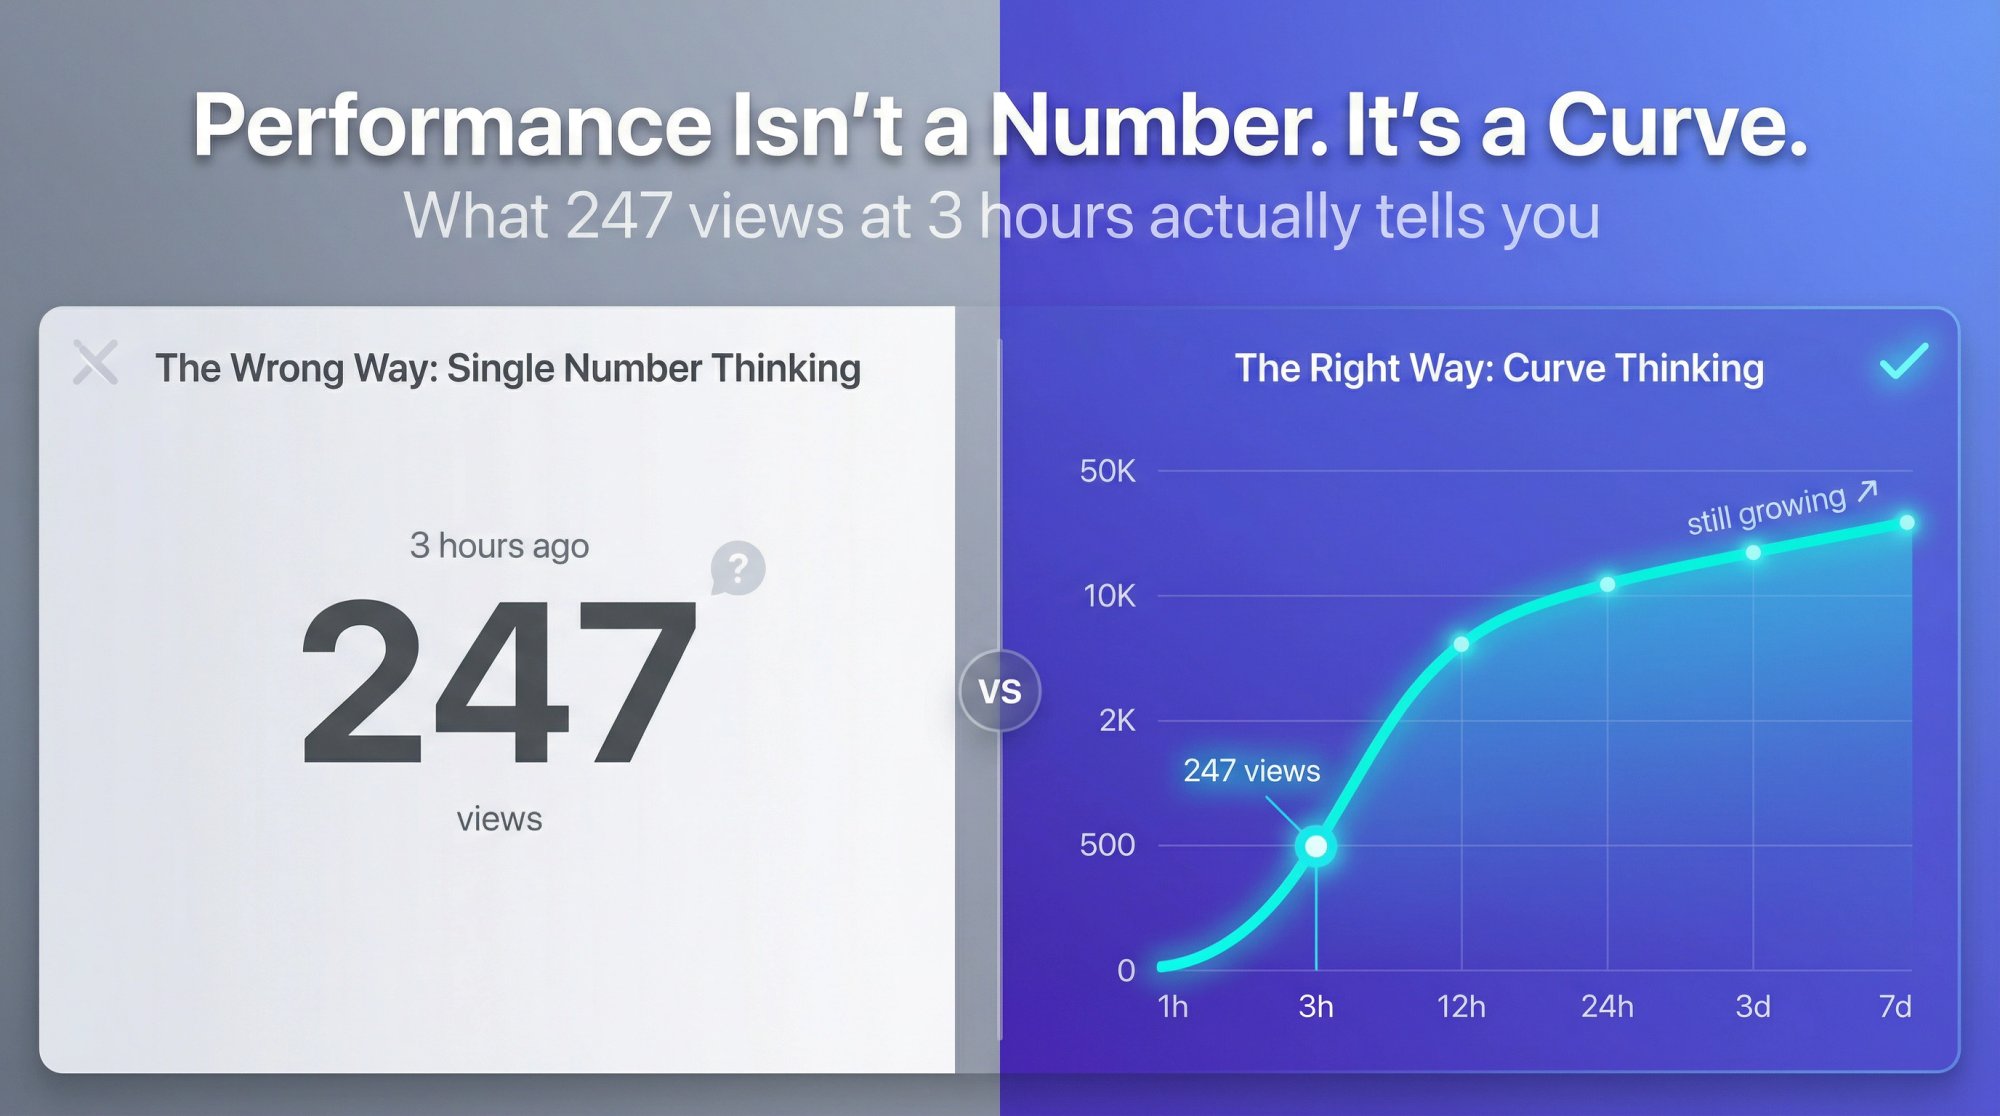
Most creators check their view count once, maybe twice, then move on. But if you're serious about growing on TikTok, you need to understand something fundamental: performance isn't a number, it's a curve. And that curve tells you everything about whether your video is warming up or already dying.
This guide shows you exactly how TikTok videos accumulate views over time, what "good" actually looks like at each stage, and when to take action. By the end, you'll have a system for tracking TikTok performance that works whether you're managing one account or fifty.
Why Checking Views Once Doesn't Tell You Anything
Here's what trips up even experienced creators:
Two videos both have 100,000 views. One got 95k in the first day, then flatlined. The other started with 20k and climbed steadily for three weeks.
Which one's the winner?
If you only look at totals, you can't tell. But look at the curve and the story becomes obvious. The first video got tested by the algorithm, failed to hold attention, and got buried. The second one found its audience and kept growing.
This is why tracking views over time matters more than any single metric you're probably watching right now.
How Long Do TikTok Videos Get Views? The Data
Let's start with what we know from large-scale analysis.
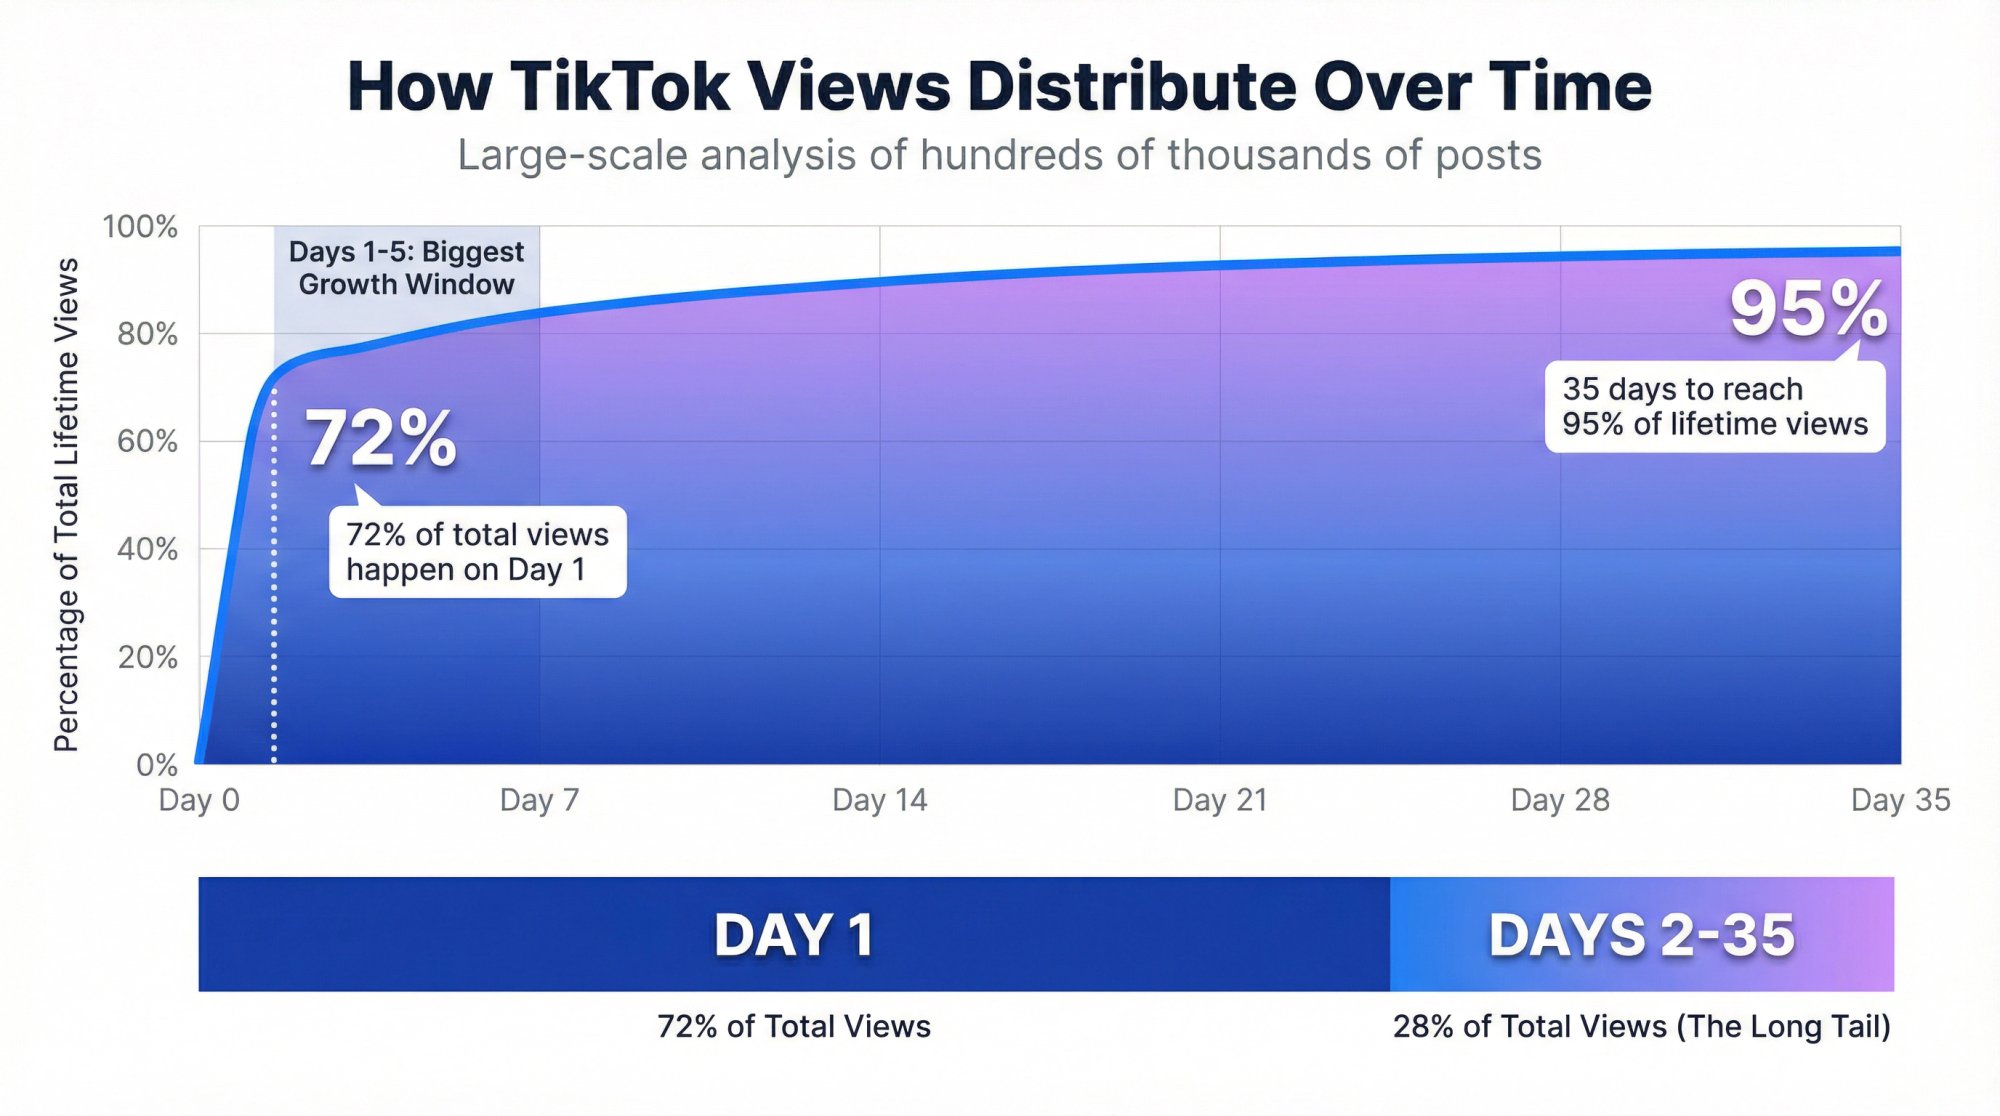
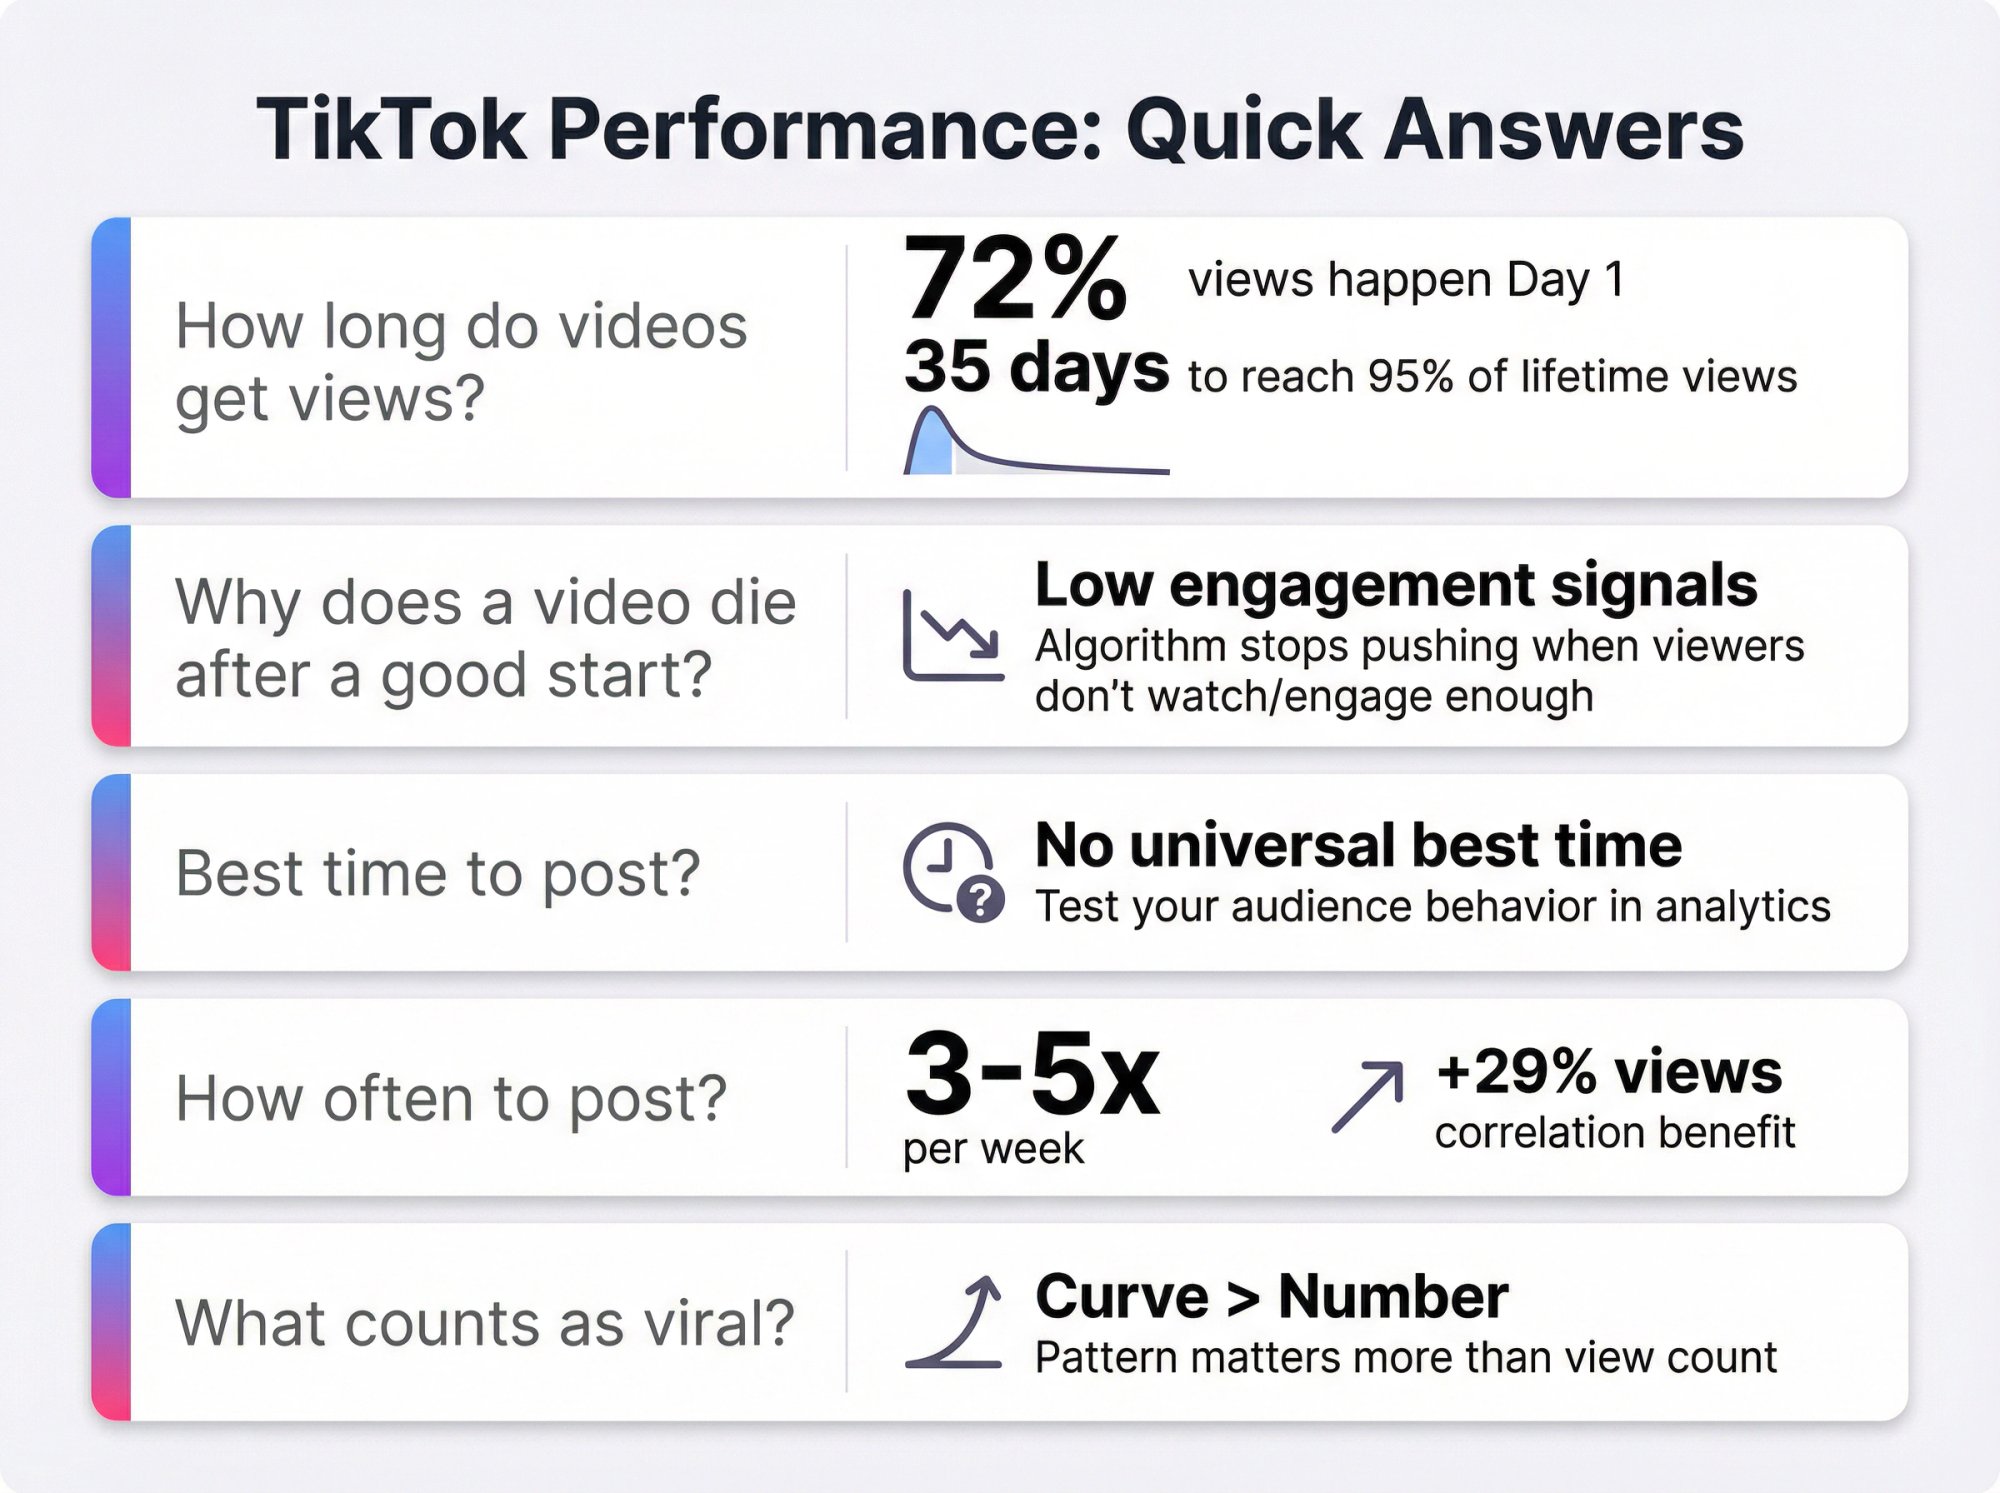
Research analyzing hundreds of thousands of posts found that roughly 72% of a TikTok's total views happen on day one. That's not a typo. Nearly three-quarters of your views arrive in the first 24 hours.
But here's the part people miss: the average TikTok takes about 35 days to reach 95% of its lifetime views. So yes, it's front-loaded. But there's still a meaningful tail.
Studies of 6 million TikTok posts from early 2025 confirmed this pattern. The biggest surge typically happens in days 1 to 5, then growth slows but continues steadily after that.
What this means for you:
Your biggest learning signal arrives fast (usually within 72 hours). But your true outcome isn't final for weeks, especially if you're creating evergreen or search-driven content.
Stop judging your videos at the 24-hour mark and calling it done. You're missing half the story.
How the TikTok Algorithm Decides Which Videos to Push
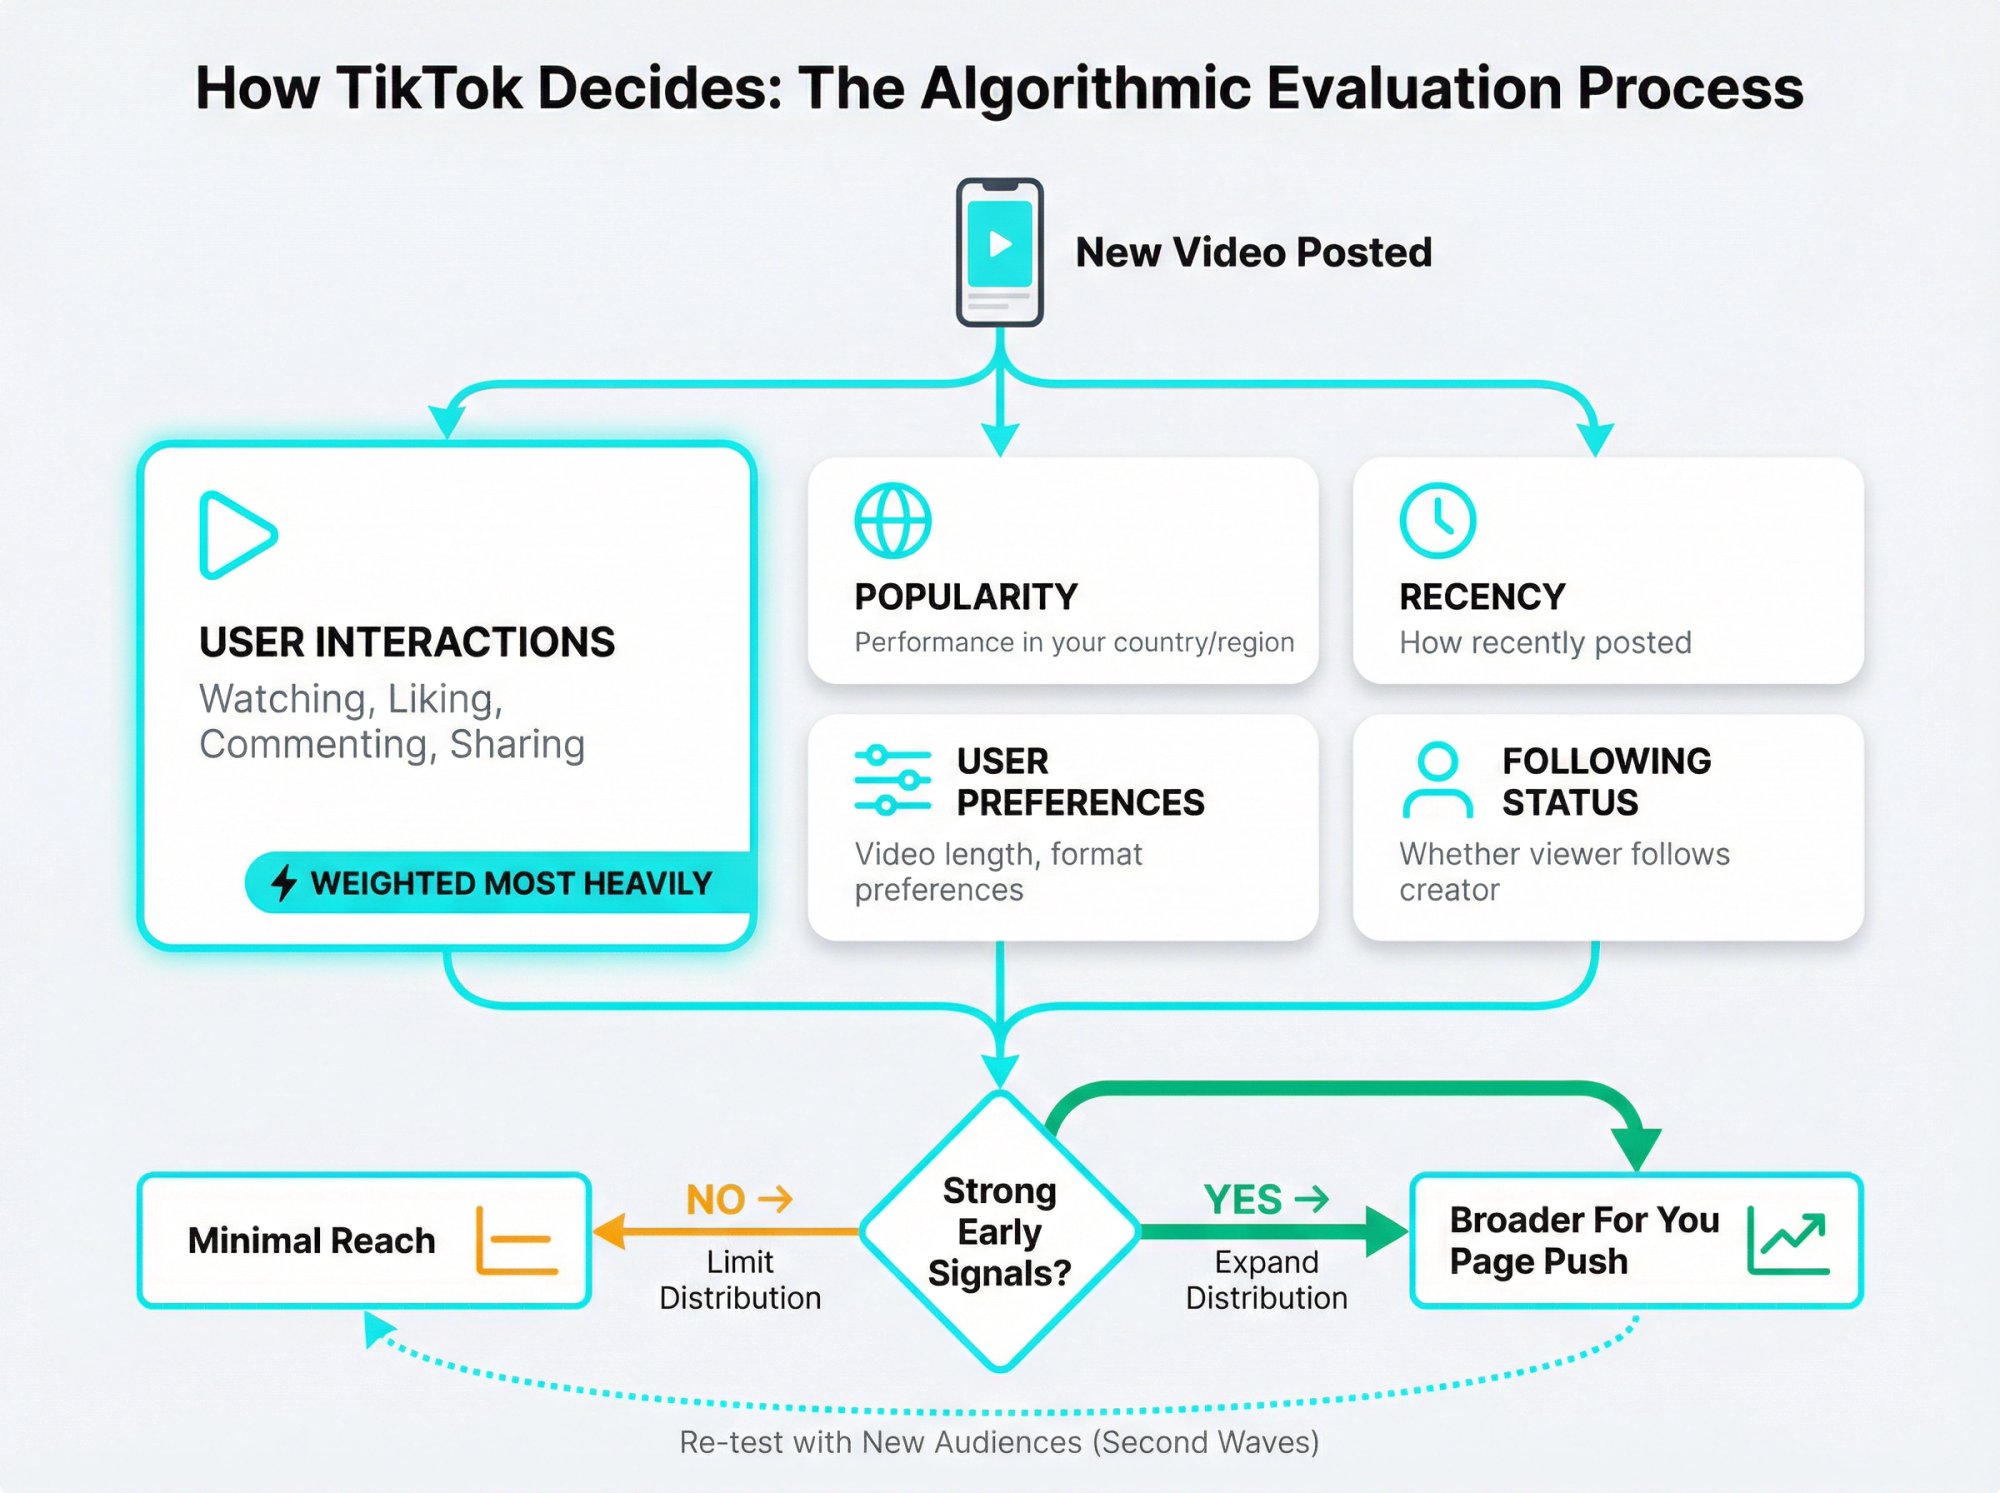
You don't need to reverse-engineer the algorithm to understand performance over time. TikTok itself tells you what it uses for recommendations:
Your interactions with similar posts (watching, liking, commenting, sharing)
Popularity in your country or region
Recency (this post was created recently)
User preference patterns (like video length preferences)
Whether you follow the creator
The platform also states that user interactions are generally weighted more heavily than other factors.
Here's why this matters for tracking performance: TikTok can re-test or re-surface content when it finds new audiences who engage well with it. Early viewer behavior influences whether the system expands distribution. And recency matters, but it's not the only lever (which is why "second waves" happen).
Your job is to measure what's happening at each phase so you know why a video performs the way it does.
The 5 Phases of TikTok Video Performance (What to Track When)
Most view curves move through predictable phases. Here's how to read them:
Phase 1: Launch + Indexing (0 to 60 Minutes)
What's happening:
TikTok indexes your post and early viewers give "first signals" about whether it's worth showing to more people.
What to measure:
→ Early view velocity (views per minute)
→ Early engagement velocity (likes, comments, shares per minute)
→ Watch time and completion rate (if you have access to creator analytics)
What to do:
Reply to early comments immediately. This deepens session time and signals engagement. Pin a comment that frames the "why watch" or asks a question that prompts replies.
If the hook is unclear, don't edit the original. Create a better "Version B" later and test it fresh.
Phase 2: First 24 Hours (When TikTok Decides to Expand Your Reach)
What's happening:
This is when TikTok decides whether your video deserves broader For You Page distribution.
What to measure at 24 hours:
| Metric | Why It Matters |
|---|---|
| Views (24h) | Raw distribution signal |
| Engagement efficiency | (likes + comments + shares) ÷ views |
| Share rate | shares ÷ views (higher = stronger social proof) |
| Follower lift | New followers attributed to the post |
Important nuance: TikTok counts a view as soon as a video starts playing, and loops or repeats can count. So raw view count isn't "unique reach."
What to do:
If the post is above your baseline, immediately plan a follow-up video. Script a "part 2" hook or create a series angle (same topic, different proof or example).
If it's below baseline, wait. Don't overreact yet. The curve might still build. Understanding what is a good view rate for TikTok helps you set realistic expectations.
Phase 3: Days 2-5 (Your Biggest Growth Window)
What's happening:
Large-scale data shows this is often the highest-growth window for many posts.
What to measure:
① Day-over-day growth (change in views)
② Whether engagement efficiency is improving or degrading
③ Whether comments are generating "thread depth" with back-and-forth replies
What to do:
Make the follow-up while the audience is hot. If you're a brand, capture UGC-style variants now while the concept is validated. Consider stitch or duet reactions if relevant.
Phase 4: Days 6-35 (The Long Tail That Most People Ignore)
What's happening:
Most posts slow down, but many still accumulate meaningful incremental views for weeks. The "95% by day 35" finding is a useful mental anchor for planning reviews.
What to measure:
Long-tail ratio: views gained days 6 to 35 ÷ views gained days 1 to 5
This tells you if the content is evergreen or trend-based. Also watch for search discoverability signals if you can see traffic sources inside TikTok analytics.
What to do:
Turn winners into evergreen assets. Re-cut into tighter versions. Repackage with new hook text. Add an FAQ-style caption for search intent. Learn more about TikTok SEO optimization to maximize long-tail performance.
Phase 5: Second Waves (When Old Videos Go Viral Again)
What's happening:
A second wave can come from trend revival, new cohort matching (TikTok finds a better audience), external sharing through Discord or Slack, or search intent spikes.
What to measure:
• Sudden slope change (views per day jumps)
• Whether engagement efficiency stays healthy during the jump
What to do:
Publish follow-ups immediately with the same topic but a new angle. Pin a comment linking viewers to the follow-up. For brands: route momentum toward conversion with a profile CTA or landing page link-in-bio strategy.
Which TikTok Metrics Actually Predict Performance
Stop drowning in vanity metrics. Here's the simplest breakdown:
| Metric Type | Examples | What They Tell You |
|---|---|---|
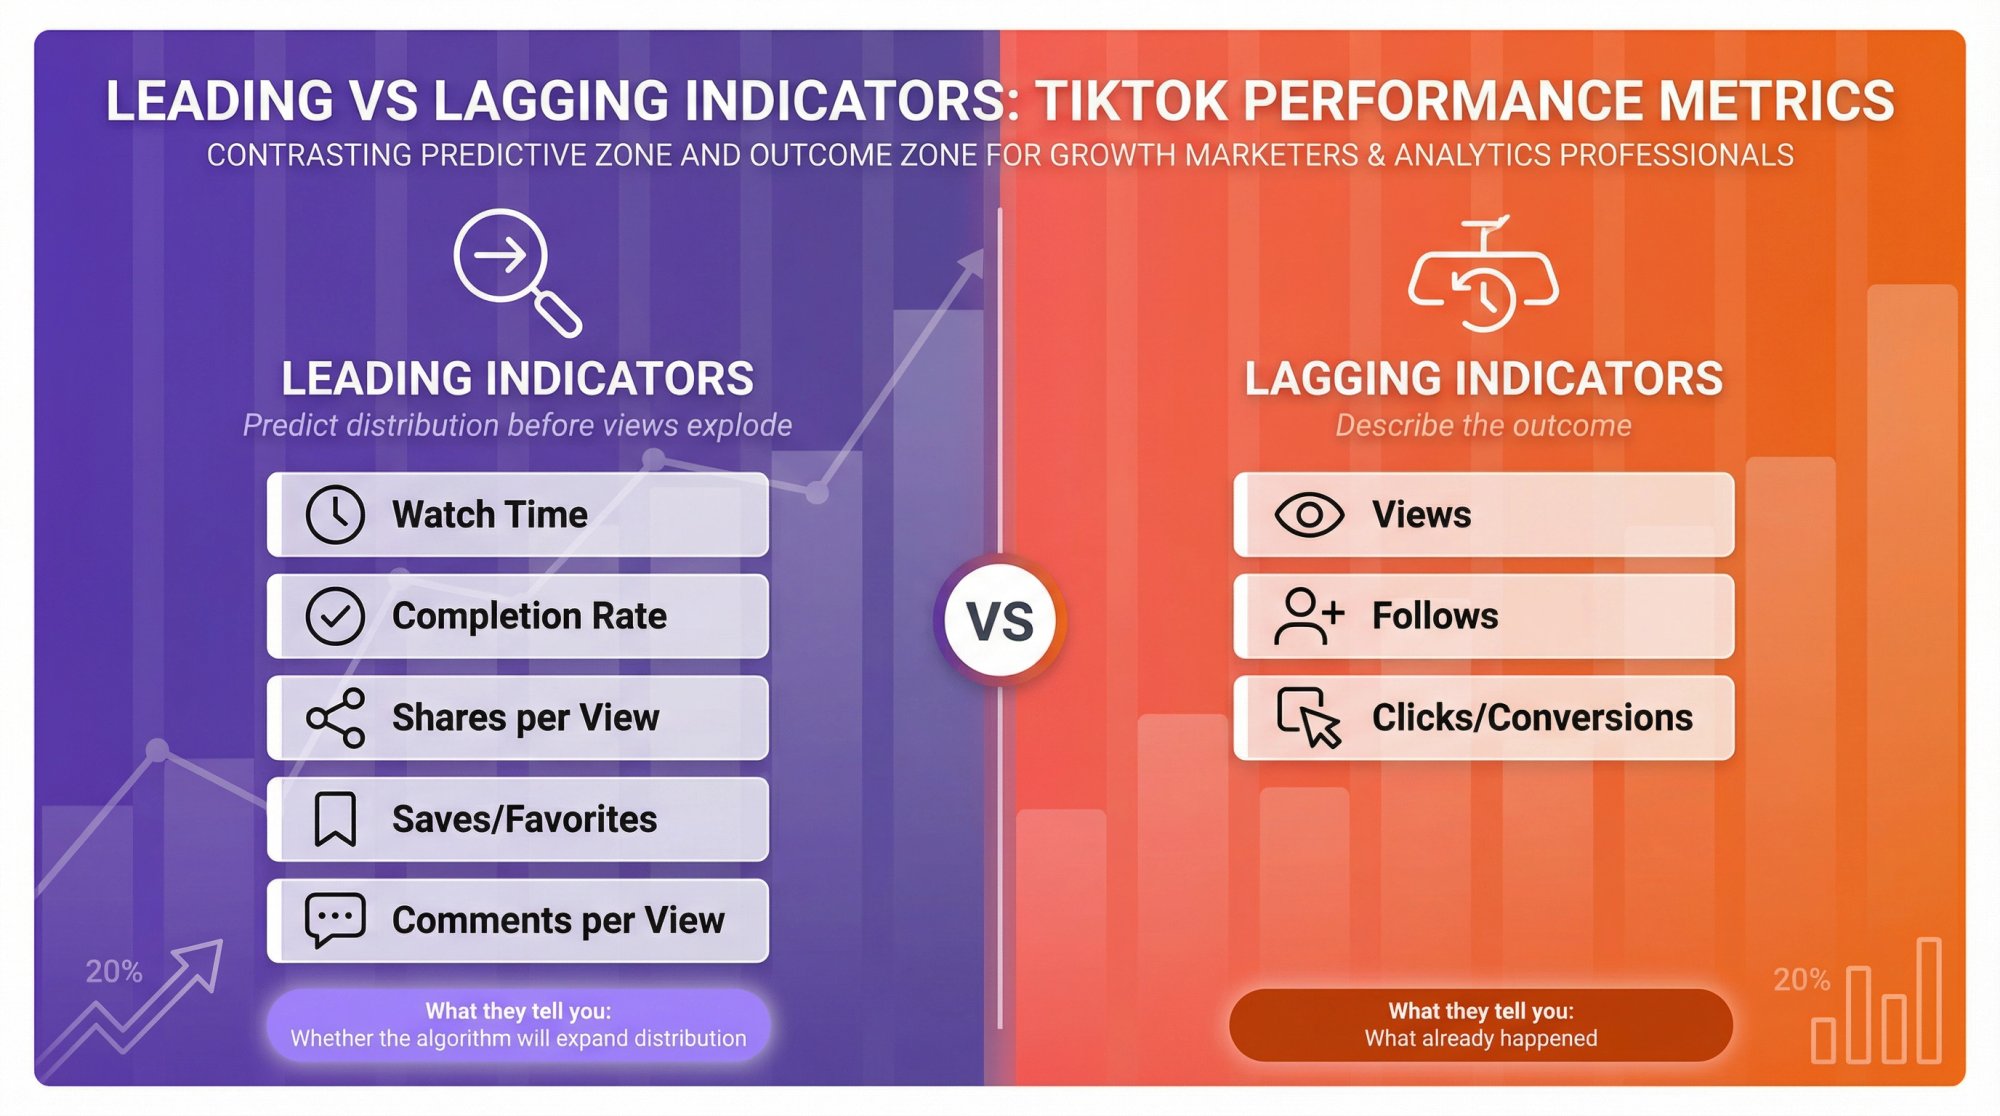
| Leading indicators (predict distribution before views explode) | Watch time, completion rate, shares per view, saves/favorites, comments per view | Whether the algorithm will expand distribution |
| Lagging indicators (describe the outcome) | Views, follows, clicks or conversions | What already happened |
If you're running ads (like Spark Ads), TikTok's Business Help Center defines video view metrics precisely: 2-second views, 6-second views, view-through rates at 25/50/75/100%, and average play time.
Use these definitions for paid reporting. But don't compare them 1:1 with organic view behavior. They're measuring different things.
Understanding what is a good engagement rate on TikTok helps you benchmark your performance against industry standards.
How to Read TikTok Views Over Time Charts Like a Pro
You'll see the same curve shapes repeatedly. Each one implies a different action.
1) Spike to Cliff (The "Failed Test")
Pattern: Huge day one, then flat.
Meaning: The system tested it, but retention or engagement didn't justify expansion.
Likely causes: Hook mismatch (title promises X, video delivers Y). Weak pacing after the first 1 to 2 seconds. Audience mismatch (wrong people shown it early).
Action: Re-edit into a tighter cut. Rewrite the hook (both visual and spoken). Keep the core idea, change the packaging.
If you're experiencing this pattern frequently, read our guide on why your TikTok video is getting 0 views to diagnose the root causes.
2) Slow Burn (The "Evergreen/Search" Post)
Pattern: Moderate start, consistent daily growth.
Meaning: Strong relevance or search discoverability.
Action: Make companion posts targeting adjacent search intents. Turn the concept into a series. Keep the format stable and improve clarity.
3) Second Wave (The "Re-Surface")
Pattern: Flat, then sudden jump days later.
Meaning: TikTok found a new audience or an external trigger occurred.
Action: Publish a follow-up immediately. Pin a comment linking to related posts. Consider a "Version B" repost with a new hook if the topic is peaking again.
4) Stair-Step Growth (Multiple Pushes)
Pattern: Growth in steps rather than a smooth curve.
Meaning: Multiple recommendation cycles.
Action: Don't touch it. Don't delete. Don't private. Feed engagement by replying, pinning, or asking follow-up questions in comments.
5) Flatline From the Start (The "Packaging Problem")
Pattern: Never gets traction.
Meaning: Either it's not compelling enough for the initial test group, or it's miscategorized.
Action: Move on quickly, but extract a lesson. Was the hook clear? Was there payoff? Did it start mid-action or with context?
How to Build Your Own TikTok Performance Benchmarks
You don't need universal benchmarks. You need your own.
That said, it helps to have a reality check. Recent analysis of 2 million videos from over 23,000 profiles reported an average engagement rate by views of 3.85% in 2024.
Treat this as context, not a goal. Niche and audience maturity matter a lot.
The Benchmark Method That Actually Works
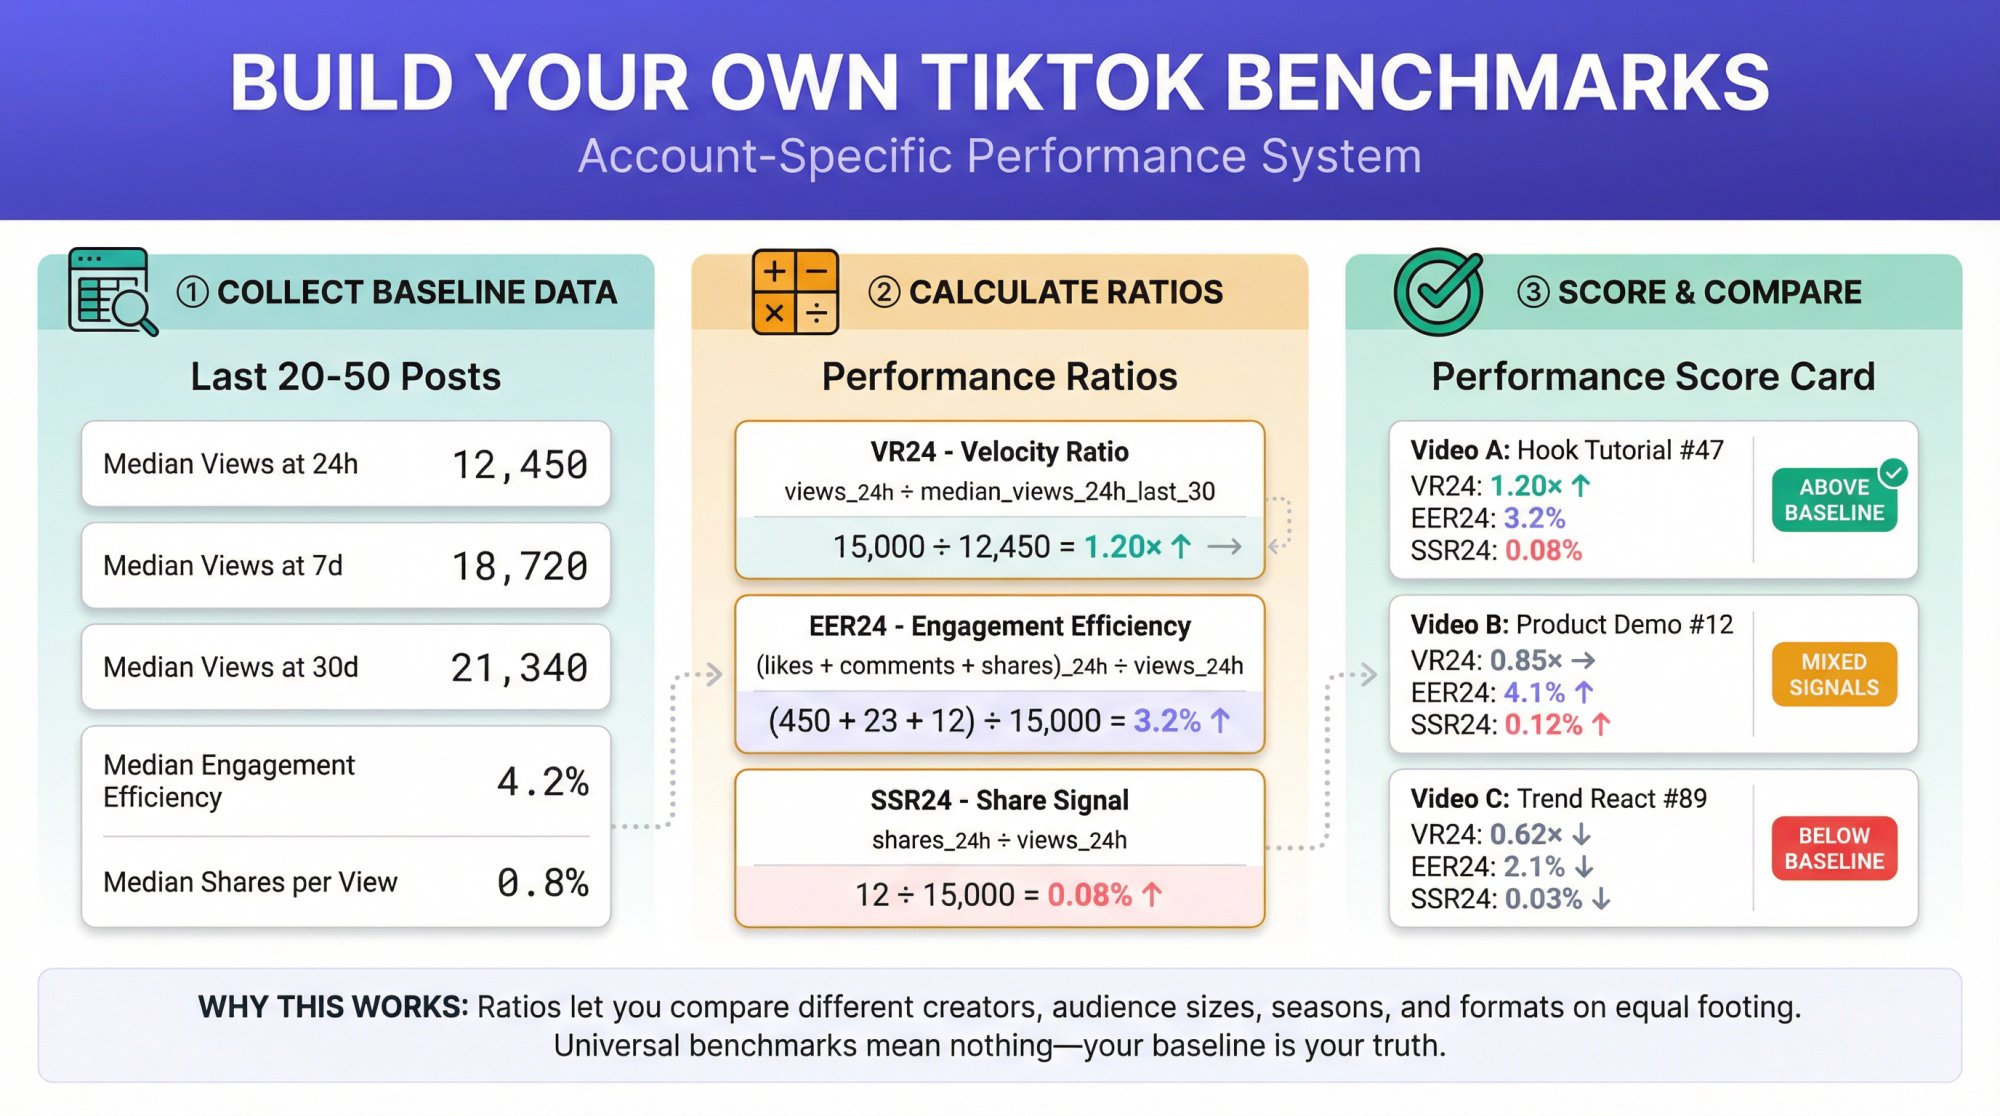
For each account, compute:
• Median views at 24h, 7d, 30d (last 20 to 50 posts)
• Median engagement efficiency at 24h
• Median shares per view at 24h
Then score each new post by ratios, not raw numbers:
| Formula | What It Measures |
|---|---|
| Velocity Ratio (VR24) | views_24h / median_views_24h_last_30_posts |
| Engagement Efficiency Ratio (EER24) | (likes+comments+shares)_24h / views_24h |
| Share Signal (SSR24) | shares_24h / views_24h |
This lets you compare different creators, different audience sizes, different seasons, and different formats on equal footing. For comprehensive benchmarking strategies, explore our guide on conducting TikTok competitor analysis.
How to Predict Final Views from Day 1 Performance
No forecast is perfect (TikTok has outliers and second waves), but you can use dataset anchors to build useful expectations.
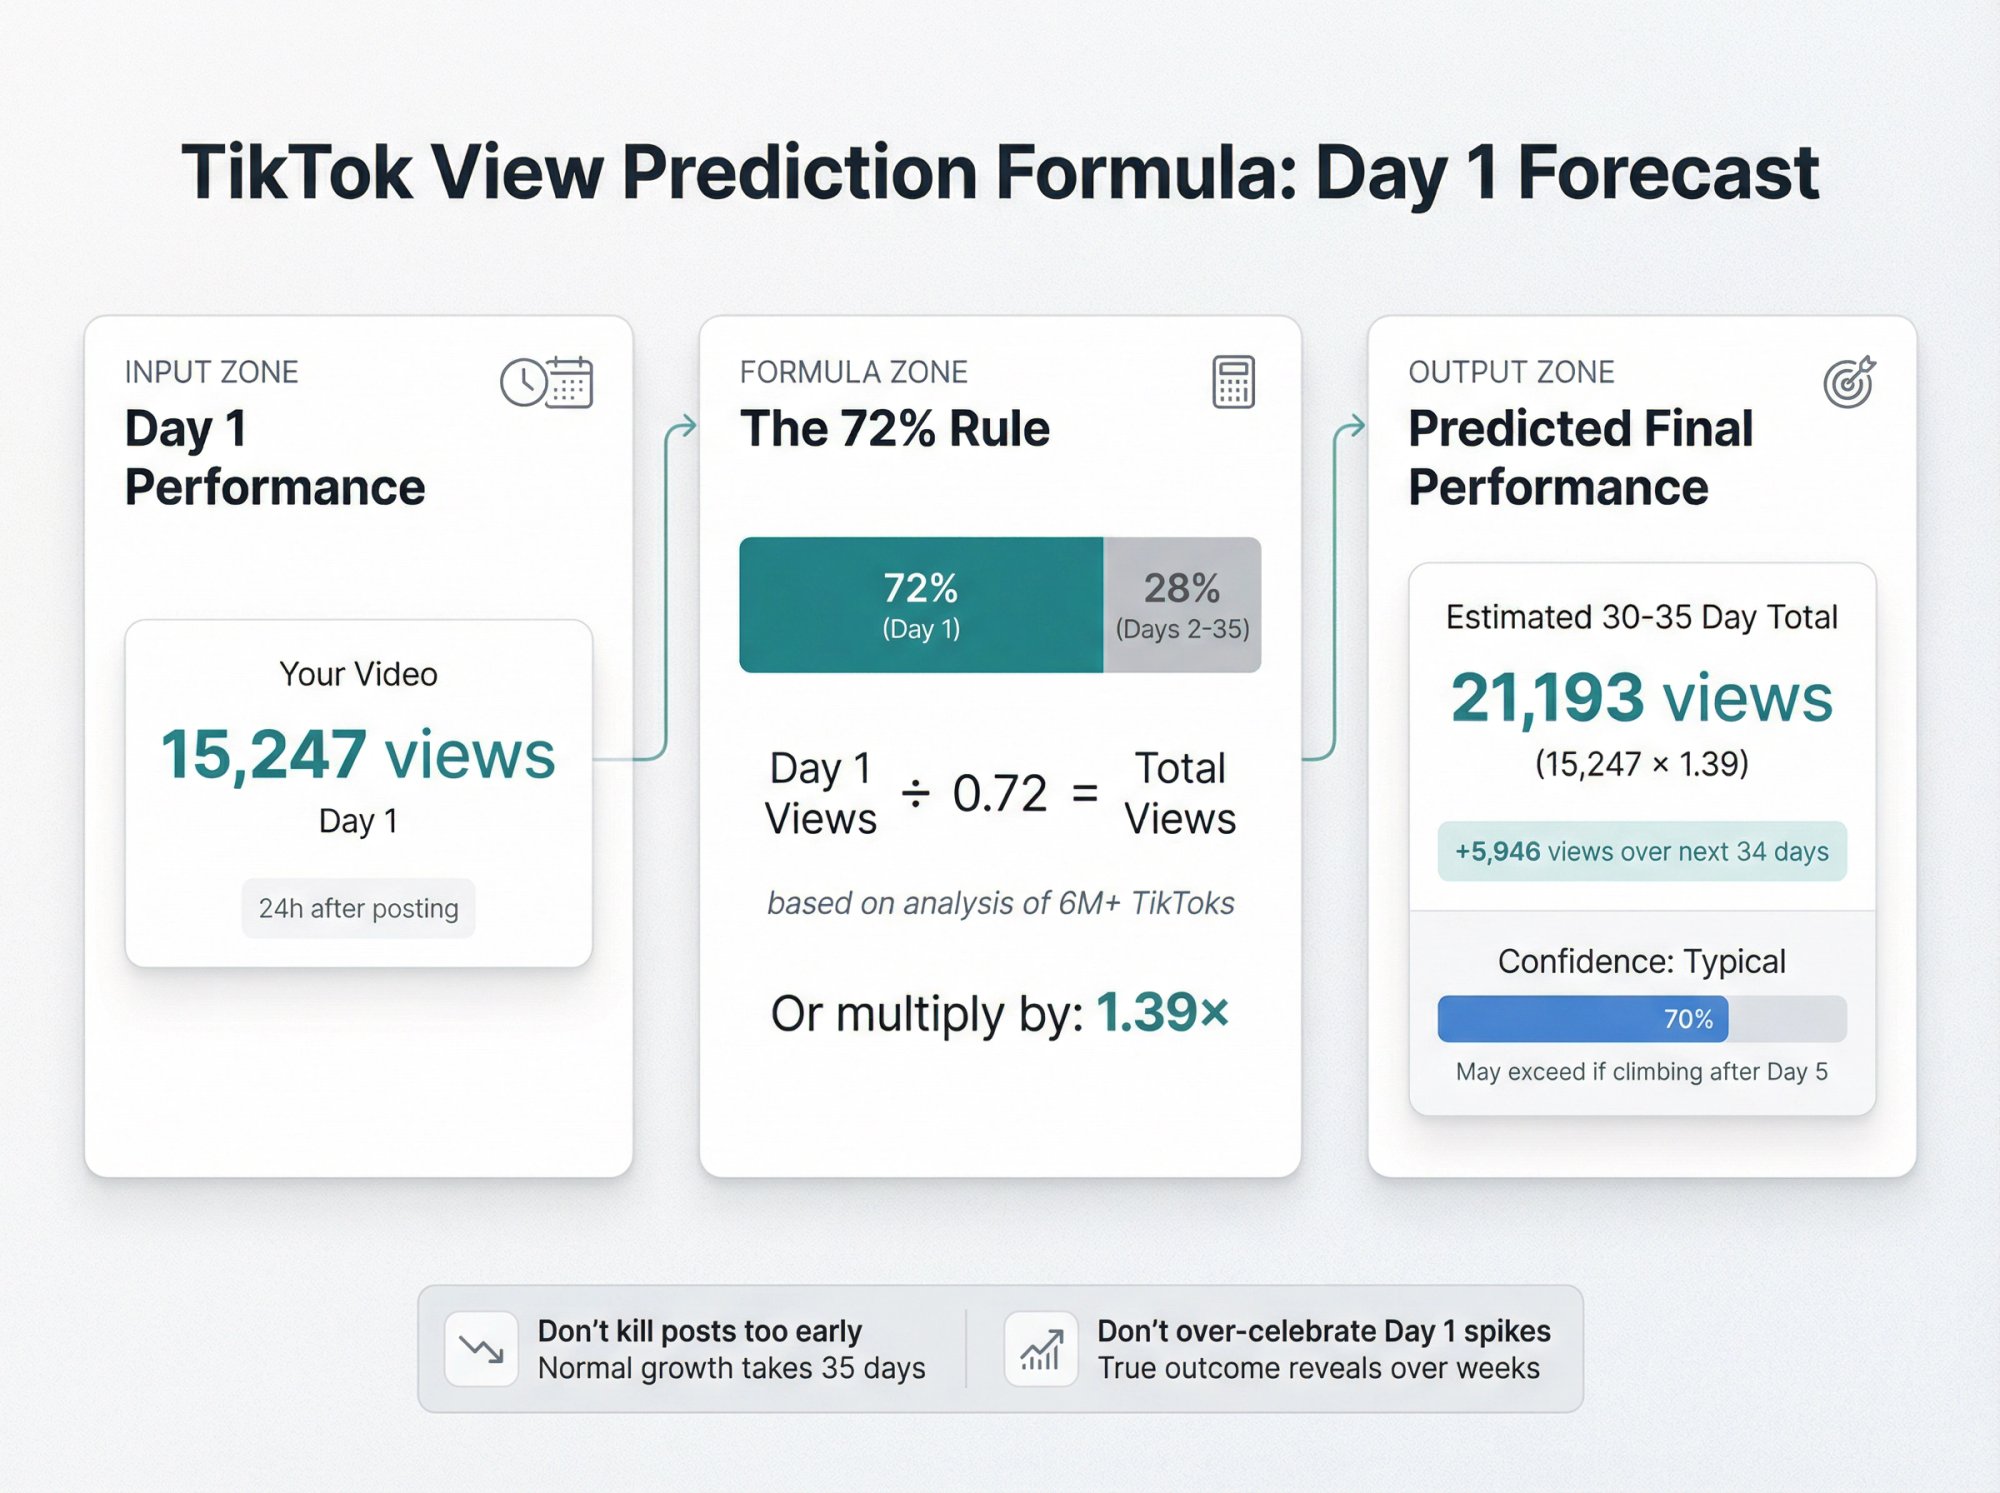
If roughly 72% of views happen on day one on average, then a rough "typical" multiplier is:
Estimated 30 to 35 day views ≈ day-1 views ÷ 0.72 ≈ 1.39× day-1 views
If a post is still climbing strongly after day 5, it may beat this. But this heuristic helps you avoid two common mistakes:
Killing a post too early when it's simply "normal."
Over-celebrating a day-one spike that won't persist.
When to Post on TikTok for Maximum Early Momentum
Early momentum matters. Two recent datasets are useful here:
Posting Frequency
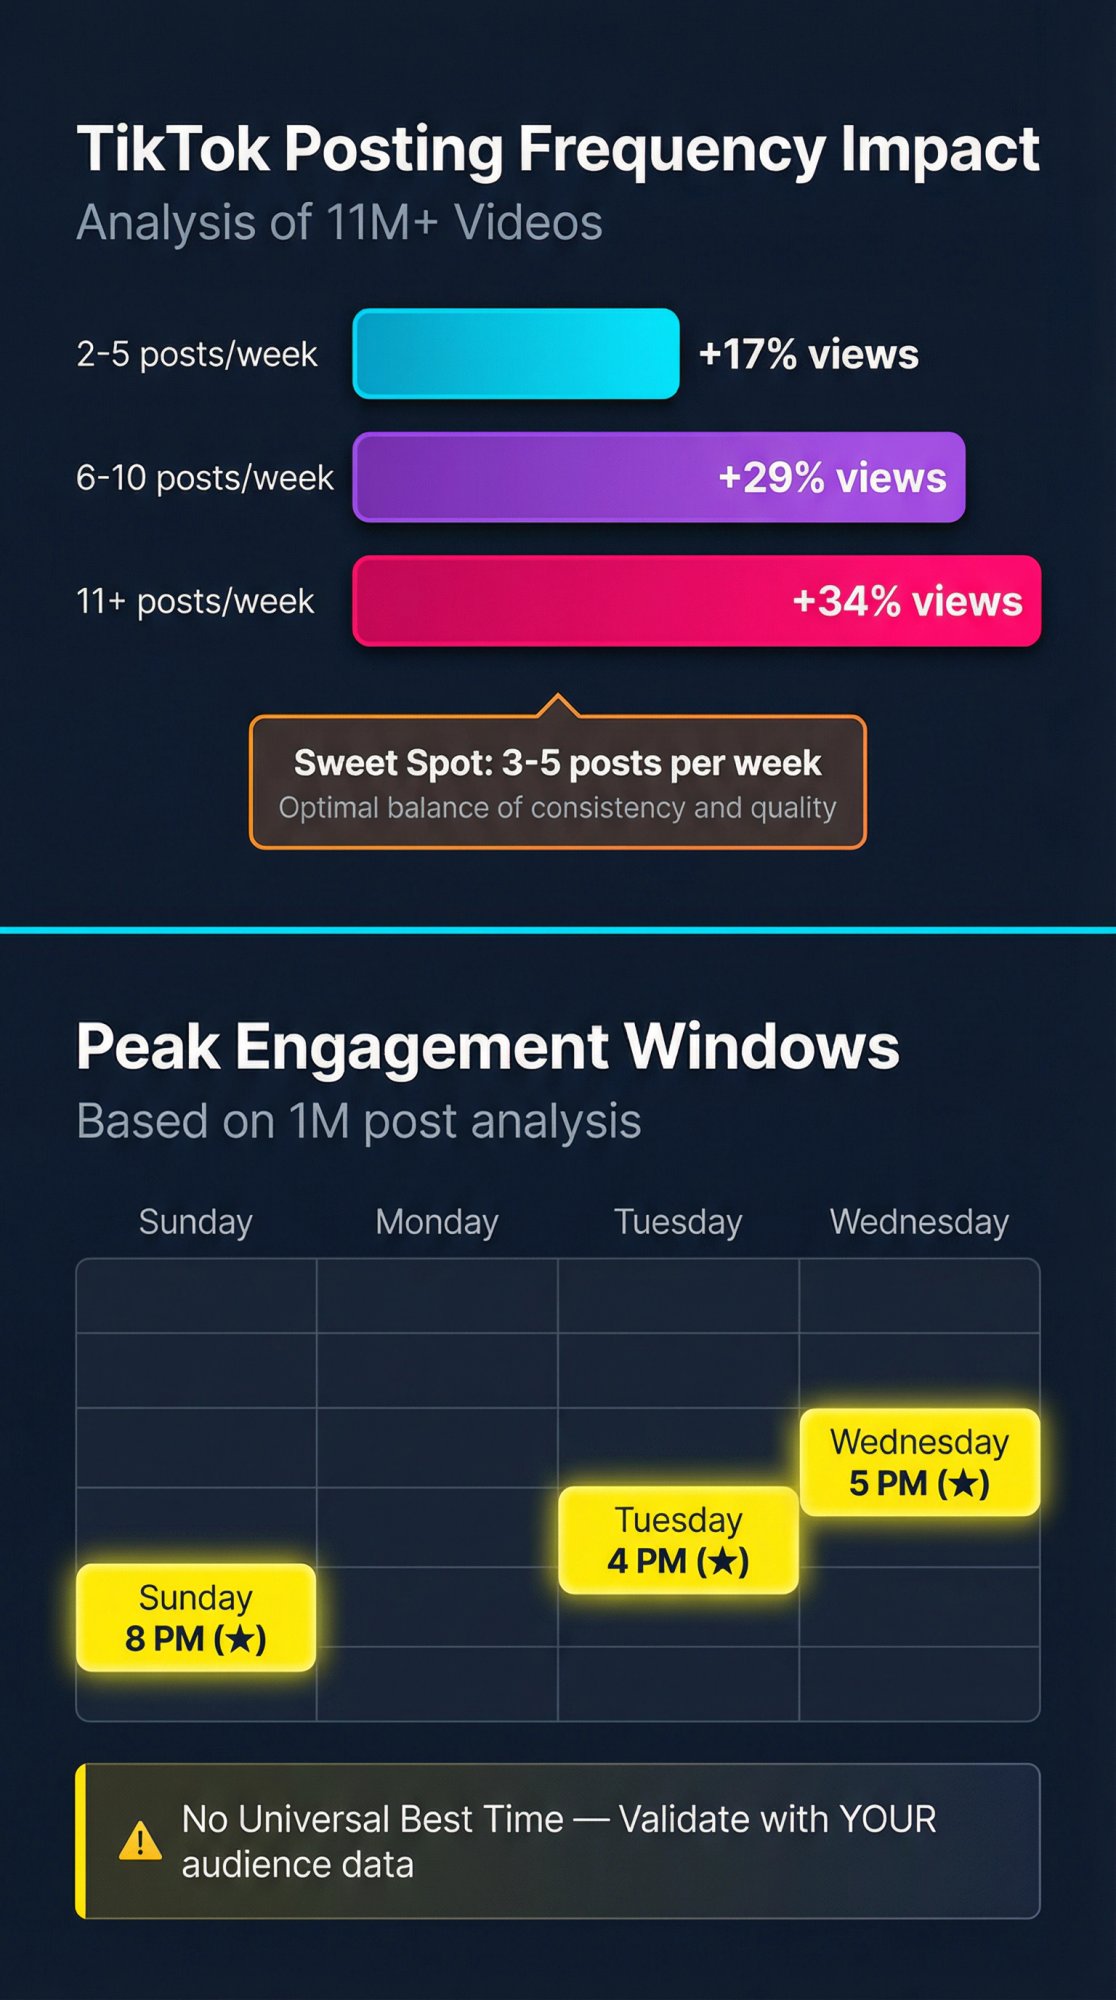
Analysis of 11+ million TikToks recommends posting 3 to 5 times per week as an ideal consistency target. Data shows higher posting frequency correlates with higher views per post:
| Posting Frequency | Views Per Post Increase |
|---|---|
| 2 to 5 per week | +17% |
| 6 to 10 per week | +29% |
| 11+ per week | +34% |
Consistency helps, but only if quality stays high.
Learn more about how often to post on TikTok for optimal growth.
Timing
Recent analysis of 1 million posts reports standout posting windows like Sunday 8 p.m., Tuesday 4 p.m., and Wednesday 5 p.m.
But experts stress there's no universal best time. You should validate against your audience activity.
How to use this for performance over time:
Posting at the right time doesn't make a bad video good. But it can meaningfully improve the early test conditions, which can influence the entire curve.
What to Check at 1 Hour, 24 Hours, 72 Hours, and 30 Days
Here's a battle-tested cadence for growth teams:
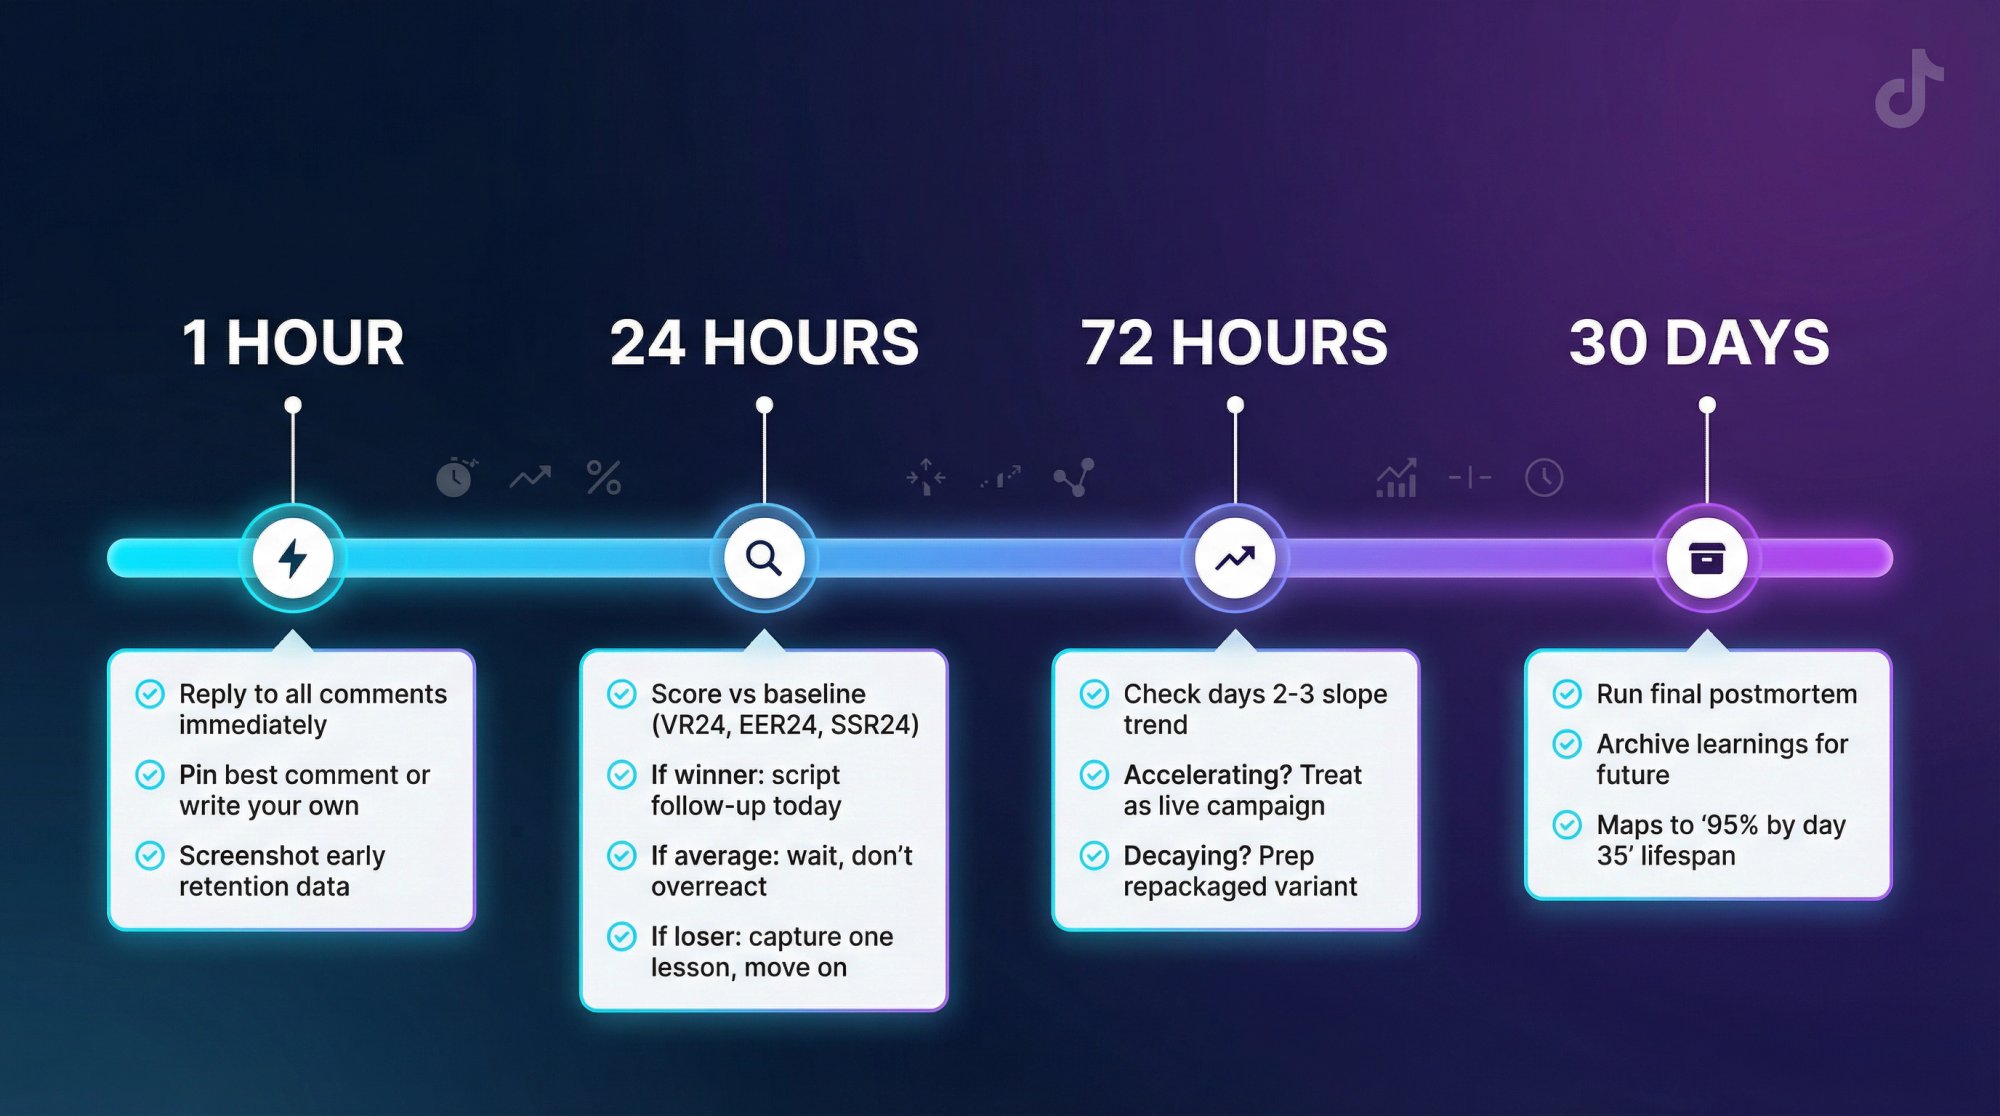
At 1 hour:
Reply to all comments fast. Pin the best comment (or write your own). Screenshot early retention if you have it for later learning.
At 24 hours:
Score the post versus baseline (VR24, EER24, SSR24).
If it's a winner: Script and film the follow-up today. Start turning it into a repeatable format.
If it's average: Wait. Don't overreact.
If it's a loser: Capture one lesson and move on.
At 72 hours:
Look for the "days 2 to 3 slope." Is it accelerating or decaying?
If accelerating: treat it as a live campaign. If decaying: prepare a repackaged variant for later.
At 7 days:
Categorize the post as trend spike, evergreen slow burn, second wave, or flat fail. Update your creative rules accordingly.
At 30 to 35 days:
Run your "final" postmortem and archive learnings. This maps well to the "95% by day 35" lifespan concept.
For a comprehensive approach to end-of-month TikTok analytics, use this timeline to optimize your next month's content strategy.
How to Track TikTok Performance Over Time at Scale
If you're managing multiple accounts, creators, or competitor sets, the bottleneck becomes obvious:
TikTok gives you insight, but not operations.
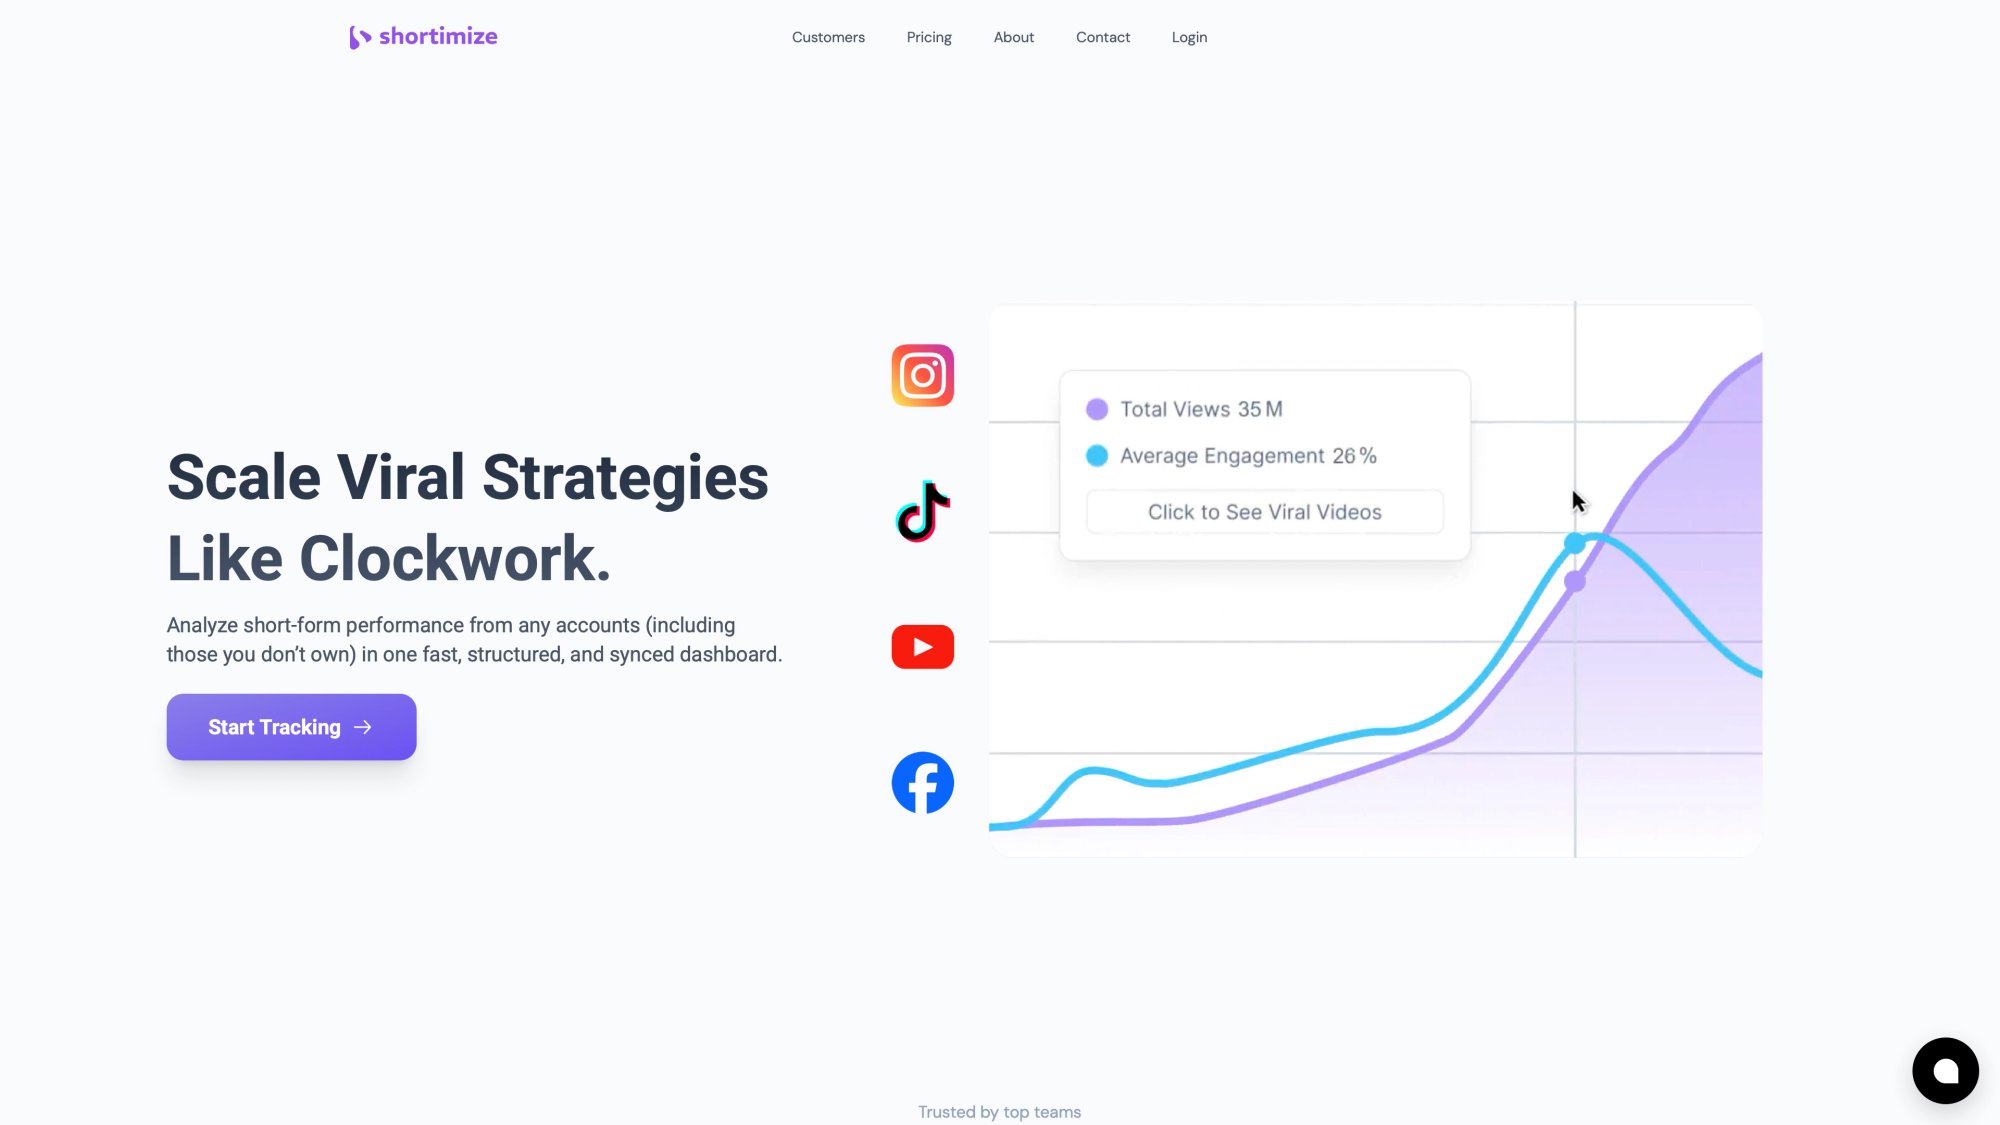
This is exactly why we built Shortimize. We track public video performance over time across TikTok (and other short-form platforms) as a single source of truth.
A Practical Shortimize Workflow for Performance-Over-Time Tracking
1. Track the account + every new video automatically
Build a Collection per campaign, creator, or competitor set. When you add an account, we automatically pull in all current videos and monitor for new uploads.
2. Measure growth as deltas (not totals)
The most actionable metric is often day-over-day change:
• Δviews/day
• Δlikes/day
• Δcomments/day
That's how you detect slope changes and second waves in real time.
3. Standardize reporting windows
Use consistent snapshots at Day 1, Day 3, Day 7, and Day 30. Our platform refreshes data on 12-hour or 24-hour cycles depending on your plan, so you always have up-to-date curves.
4. Alert on "curve breaks"
The best teams don't monitor everything. They get notified when something unusual happens (like view velocity spikes). We're building alert functionality to surface these inflection points automatically.
5. Export or sync to your analytics stack
We offer API and webhook access (plan-dependent) so you can pull performance data into your existing dashboards or trigger automation when certain thresholds are hit.
Refresh Rate Matters for "Over Time" Analysis
Our pricing page lists plan refresh defaults:
| Plan | Refresh Rate |
|---|---|
| Pro | 24-hour refresh |
| Business | 12-hour refresh |
| Optional | 4-hour or 1-hour (plan-dependent) |
This is important because performance over time is fundamentally a time series problem. The more frequently you sample, the earlier you can detect inflection points.
If you're serious about catching second waves or capitalizing on viral momentum before it fades, refresh frequency isn't a nice-to-have. It's foundational.
Templates You Can Copy Into Your Process Today
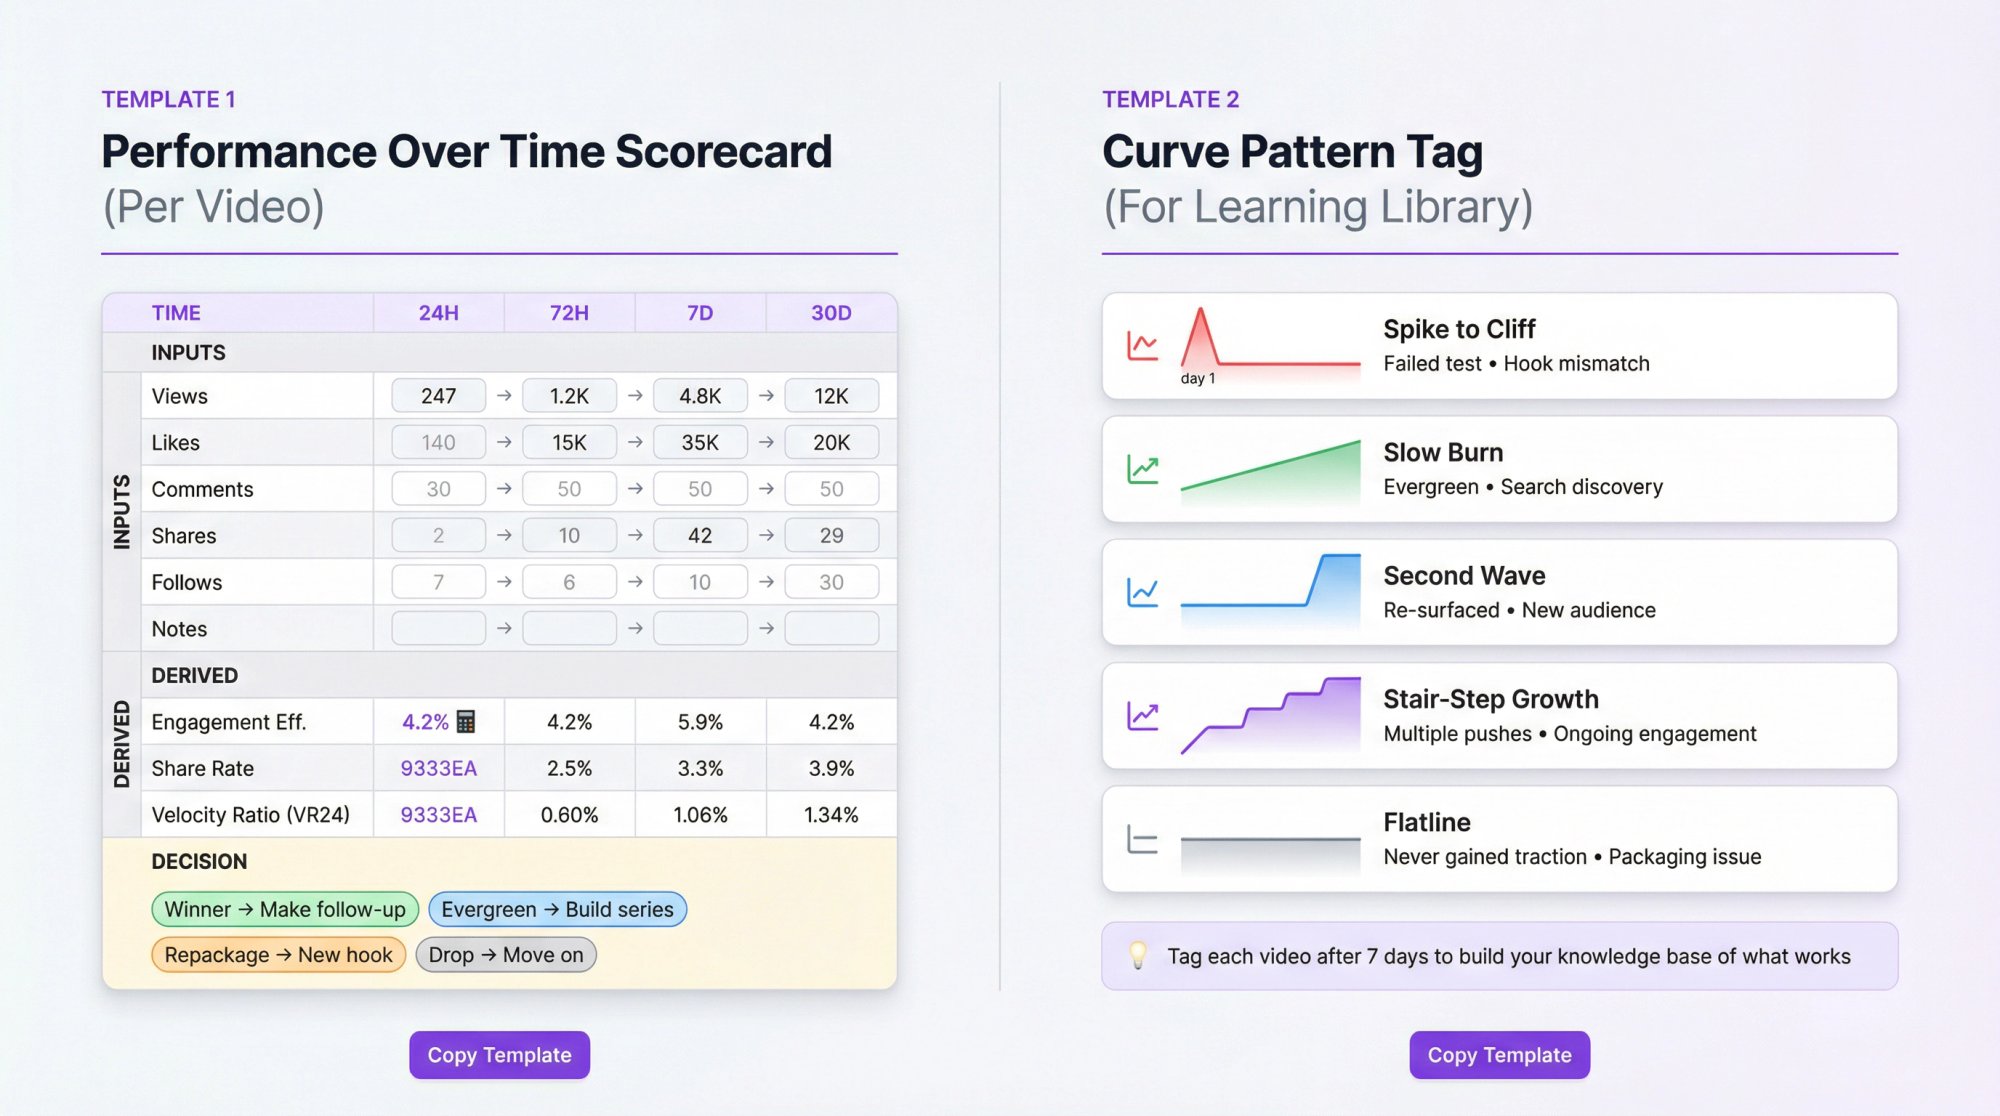
Template 1: TikTok Performance Over Time Scorecard (Per Video)
Inputs (per time window):
Views | Likes | Comments | Shares | Follows (if available) | Notes (hook type, topic, format, length)
Derived metrics:
• Engagement efficiency = (likes+comments+shares) / views
• Share rate = shares / views
• Velocity ratio (VR24) versus last-30 median
Decision fields:
Winner → "make follow-up in 24h"
Evergreen → "build series + SEO"
Repackage → "new hook variant"
Drop → "move on"
Template 2: Curve Pattern Tag (For Learning Library)
Tag each video after 7 days as one of these:
① Spike to cliff
② Slow burn
③ Second wave
④ Stair-step
⑤ Flatline
Over time, you'll build a knowledge base of which hooks create slow burns, which formats create spikes, and which topics reliably re-surface.
This is how you turn gut instinct into repeatable strategy.
FAQ
How long do TikTok videos keep getting views?
In large datasets, TikTok posts tend to be front-loaded. Research found roughly 72% of views on day one and about 35 days to reach 95% of lifetime views (average). But some posts do re-surface later with second waves, especially if TikTok finds a better audience match or the topic returns to relevance.
For strategies to increase TikTok video views throughout a video's lifecycle, focus on optimization tactics that work in each performance phase.
Why does a video die after a good start?
Usually because the initial test audience didn't watch long enough or engage enough to justify expansion. TikTok states that user interactions are generally weighted heavily in recommendations. If people bail after one second, the algorithm interprets that as "this isn't good" and stops pushing it.
Is there a best time to post?
There's no universal best time, but large studies show patterns worth testing. Analysis of 1 million posts identified high-performing time windows. But you should validate against your audience behavior using TikTok analytics to see when your followers are online.
How often should we post to improve performance over time?
Analysis of 11+ million TikToks suggests posting consistently, with 3 to 5 times per week recommended as a practical target. Higher frequencies correlate with higher views per post (up to a point). The key is sustainability without sacrificing quality.
What does "viral" mean in terms of view counts?
Understanding how many views is viral on TikTok depends on your account size and niche, but the curve pattern matters more than the total number.
Benchmarks and "average lifespans" should always be treated as directional. Your niche, geography, audience maturity, and format mix will shift the curve.
For comprehensive TikTok analytics tools to help you track performance over time, explore platforms designed specifically for this purpose.
The "Authoritative" Way to Win TikTok Over Time
If you take nothing else away:
1. Stop judging posts by totals. Start judging by curves.
2. Measure in phases (1h / 24h / day 3 to 5 / day 7 / day 30 to 35).
3. Use ratios versus your own baseline, not generic benchmarks.
4. Operationalize tracking so you can spot inflection points and repeat winners.
5. Treat TikTok like a learning engine, not a lottery.
If you want to turn this into a scalable system across many accounts (including competitors), Shortimize is built for exactly that tracking and analysis workflow. We handle the operational complexity so you can focus on making better creative decisions faster.
Our influencer tracking and social media monitoring features make it easy to track performance curves for multiple accounts simultaneously.
For teams managing campaigns across platforms, learn how to track influencer campaign performance across TikTok and Instagram using unified analytics.
Comparing platform performance? Check out our analysis on watch time across TikTok vs Reels vs Shorts to understand how performance curves differ across platforms.
For broader analytics capabilities, explore our TikTok influencer analytics tools guide to understand what data matters most for long-term success.
Because understanding performance over time isn't about watching numbers go up. It's about knowing why they go up, when to act, and what to do next.
That's how you turn short-form video from a guessing game into a repeatable growth engine.
Leave a Reply